What should a Data Analyst resume include?
A data analyst resume should include a short profile, a skills section with SQL, Excel, a BI tool and Python, experience bullets that name the data, the method and the business result, one or two projects with links, and your education. Build yours on FixDoks and keep it to a single page if you have under four years of experience.
Data Analyst Resume at a glance
| Design | Prime, two-column or decorative |
|---|---|
| Sample | PDF and Word download |
| Examples | 14 bullet points, 23 skills |
| Processing | On our server over HTTPS; files are deleted right after conversion |
| Max file size | 50 MB per file |
| Price | Free to use, no watermark |
| Download | First download free, then ₹49 for 2 months of unlimited downloads (US$3 outside India) |
| Files at once | 1 free, up to 30 with a plan |
| Works on | Chrome, Edge, Safari and Firefox on Windows, Mac, Android and iPhone |
How to use Data Analyst Resume Template
- Click Use this template to open the builder with the Prime design and a Data Analyst section order, or Edit this example to start from the sample.
- Fill in your details. Use Examples and Skills by job for ready-made lines, or the AI writer for your own notes.
- Check the resume score, paste the job ad to see missing keywords, then download your PDF.
Data Analyst resume sample
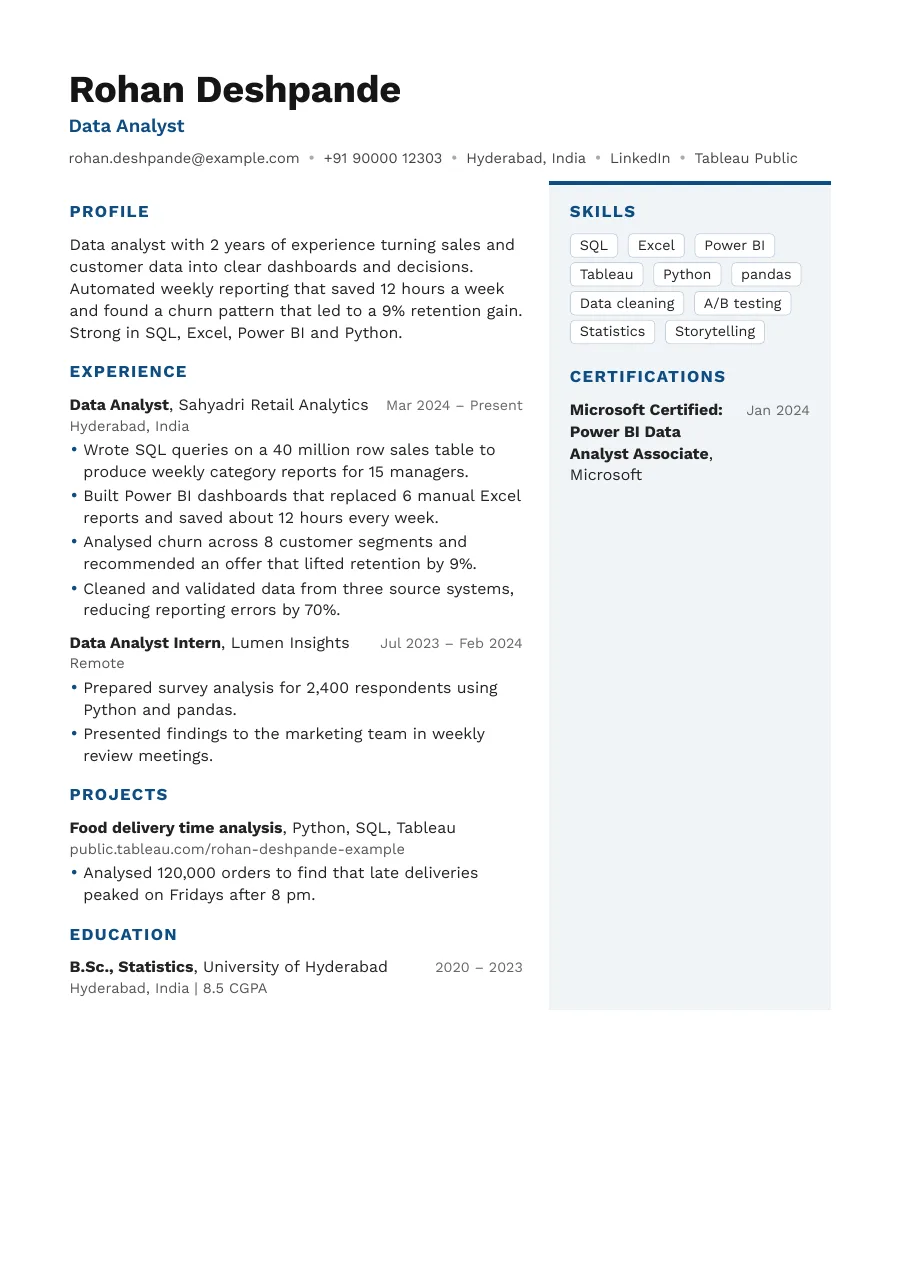
What recruiters look for in a data analyst
Hiring managers want analysts who find answers and explain them. They check for tool skills first, but they hire for judgement: did you pick the right question, clean the data carefully, and give a recommendation that someone acted on? Your resume should show that chain in every role.
Best section order
- Contact details with LinkedIn and a portfolio link such as Tableau Public or GitHub
- Profile of two or three lines
- Skills
- Experience
- Projects
- Education and certifications
For freshers, put projects before experience so your best analysis is visible quickly. The fresher resume format guide shows how.
How to write the summary
Say what kind of data you work with, the tools you use and one result. For instance: two years analysing retail sales with SQL and Power BI, found a churn pattern that lifted retention by 9%. If you want a starting point, try the summary generator.
Bullets that prove your value
| Weak | Strong |
|---|---|
| Made reports in Power BI | Built Power BI dashboards that replaced six Excel reports and saved 12 hours a week |
| Analysed customer data | Analysed eight customer segments and recommended an offer that lifted retention by 9% |
| Cleaned data | Cleaned three source systems with Python, cutting reporting errors by 70% |
Use the formula: action, data or tool, outcome. When you cannot share exact figures from an employer, use a range or a relative change, and never invent numbers you cannot defend in an interview.
Skills and ATS keywords
Applicant tracking systems search for specific tools. Common terms for this role include:
- Query and analysis: SQL, Excel, pivot tables, VLOOKUP, Python, pandas, R
- Visualisation: Power BI, Tableau, Looker Studio, dashboards, DAX
- Method: statistics, A/B testing, data cleaning, ETL, forecasting, KPI tracking
- Business: reporting, stakeholder management, requirements gathering
Compare your draft with a job posting using the ATS resume checker.
Certifications that help
Well known options include Microsoft Certified: Power BI Data Analyst Associate, the Google Data Analytics Professional Certificate and Tableau certifications. They help career changers most. A real project with a public dashboard is often worth more than another course.
A note on portfolios
If you have no employer data to show, build a portfolio from public datasets such as government open data, sports statistics or Kaggle files. Frame each project as a business question, show the cleaning steps, and end with a recommendation. One thoughtful dashboard with a short write-up beats five unfinished notebooks.
India and abroad notes
- India: freshers can list CGPA and college projects. A photo is optional and usually unnecessary.
- US, UK, Canada: leave out photo and personal details, and keep to one page unless you have many years of experience.
Tailoring and formatting
Analyst roles vary a lot. A marketing analyst post will ask for Google Analytics and campaign metrics, while a finance analyst post will stress Excel modelling and reconciliation. Read the posting, pick the five terms that matter most, and make sure they appear in your skills and in at least one bullet each. Keep one column, use plain bullets and save as PDF. Place your portfolio link near your name so a recruiter can click it immediately.
Common mistakes
- Listing tools without showing a single result
- Skill ratings out of five stars for SQL or Excel
- Projects with no dataset, method or finding
- Pasting a dashboard screenshot instead of describing the decision it supported
- Using different date formats across roles
Pick a layout from our templates and replace the sample text with your own work.
Skills for a Data Analyst resume
Pick the ones that are true for you and that the job ad mentions. In the builder, Skills by job adds them with one tap.
- SQL
- Excel
- Power BI
- Tableau
- Python
- pandas
- NumPy
- Data cleaning
- Data visualisation
- Dashboards
- A/B testing
- Statistics
- ETL
- Google Analytics
- Looker Studio
- Data modelling
- Reporting
- Git
- Critical thinking
- Communication
- Storytelling
- Attention to detail
- Stakeholder management
Data Analyst resume bullet point examples
Use these as a starting point and change the numbers and details to your own. Anything in [brackets] is a placeholder for your real figure.
- Built Power BI dashboards that replaced six manual Excel reports and saved the team about 12 hours every week.
- Wrote SQL queries on a 40 million row table to produce weekly sales reports for 15 regional managers.
- Identified a churn pattern across eight customer segments, leading to an offer that raised retention by 9%.
- Cleaned and merged data from three source systems with Python, cutting reporting errors by 70%.
- Analysed 2,400 survey responses with pandas and presented findings that shaped the next quarter's campaign plan.
- Designed an A/B test for a checkout change and showed a 4% lift in conversion with 95% confidence.
- Automated a daily sales summary email using SQL and Python, removing 90 minutes of manual work each morning.
- Created a KPI scorecard of 12 metrics that senior leadership reviewed every Monday morning.
- Reconciled monthly revenue data across two systems and corrected 340 mismatched entries before the audit.
- Presented insights to non-technical teams in plain language, helping decide [X campaigns] for the next quarter.
- Documented data definitions for [X metrics] so teams stopped reporting different numbers for the same measure.
- Forecasted monthly demand with moving averages and trend analysis, improving stock planning accuracy by [X%].
- Segmented customers by purchase behaviour into [X groups] to support more targeted email campaigns.
- Tracked website conversion funnels in Google Analytics and flagged a drop-off that cost about [X%] of sign-ups.
Resume summary examples for a Data Analyst
Data analyst with 2 years of experience in retail analytics. Skilled in SQL, Power BI and Python, with a record of building dashboards that managers actually use. Good at explaining numbers in plain language, asking the question behind the request, and checking data quality before drawing any conclusion. Comfortable presenting to managers.
Entry level data analyst with a statistics degree and four portfolio projects using real public datasets. Practised in SQL, Excel and Tableau. Eager to join a team where clean data and clear reporting guide everyday decisions, and ready to learn quickly from senior analysts while contributing from the first month.
Analyst moving from operations into data, with 4 years of experience tracking business metrics in Excel. Now trained in SQL, Python and Power BI, and ready to apply domain knowledge of supply chains to build better reports and forecasts. Known for careful checking of numbers and for patient explanations to colleagues.
More resume examples
- Cybersecurity Analyst resume
- Data Scientist resume
- DevOps Engineer resume
- Frontend Developer resume
- IT Support Engineer resume
- QA Tester resume
- Accountant resume
- Architect resume
- All resume examples by profession